git— title: “Wrong By Design” format: stat20slides-revealjs execute: echo: false —
Warmup {{< countdown "10:00" >}}
The following two questions are based on the diagram below. The diagram corresponds to a one-sided hypothesis test that uses the following null hypothesis: \(H_0: \mu = 1\), and a significance level of \(\alpha = 0.05\). If \(H_A\) represents a possible alternative hypothesis (an alternate distribution of the test statistic).
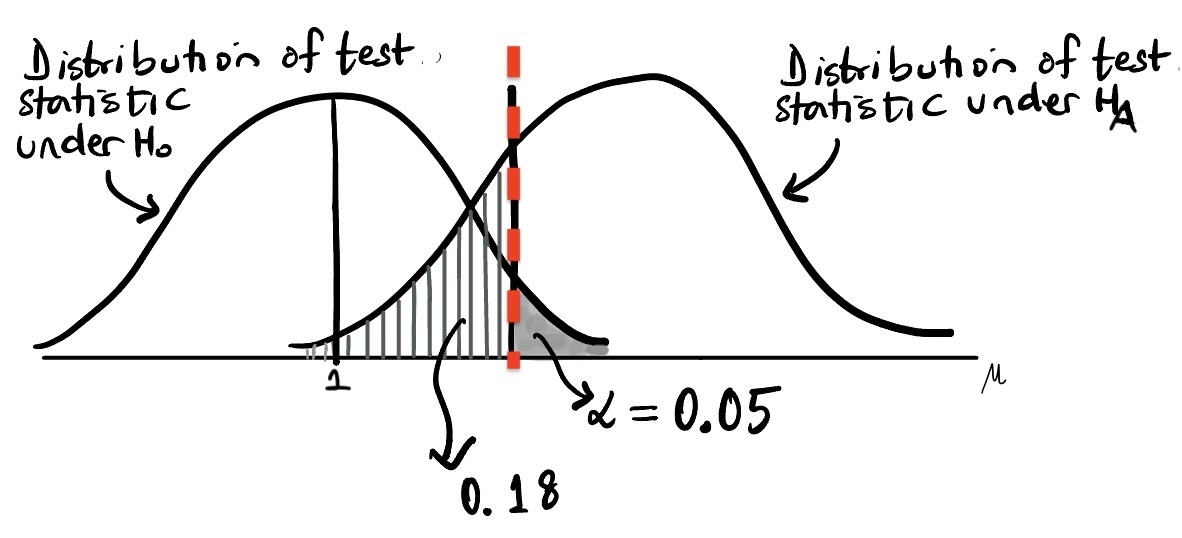
- What is an appropriate alternative hypothesis for this test based on the distribution under \(H_A\) you see?
- How does a Type I error occur (under which distribution and on what side of the dashed line)?
- How does a Type II error occur (under which distribution and on what side of the dashed line)?
- Calculate the power of this test.
- What is an appropriate alternative hypothesis for this test based on the distribution under \(H_A\) you see?
\(H_A: \mu > 1\)
- How does a Type I error occur?
- A type I error occurs when one rejects the null hypothesis even though it’s true. Based on the image, this occurs when the test statistic falls to the right of the dashed line and under the \(H_0\) curve!
- How does a Type II error occur?
- A type II error occurs when one retains the null hypothesis even though it’s false. Based on the image, this occurs when the test statistic falls to the left of the dashed line and under the \(H_A\) curve!
- Calculate the power of this test.
- The power of this test is equal to the probability that the null hypothesis is retained when it’s true. This is equal to the area under \(H_A\) but to the right of the dashed line, or \(1-0.82 = 0.18\)!