01:00
Hypothesis Tests II
STAT 20: Introduction to Probability and Statistics
Warmup
You may skip the first question. We will be collecting data from this class right now!
Getting In Shape
Wait for your instructor to display two shapes. Which of the two names belongs to the shape on the left? Answer below. You have 15 seconds!
Which of the two names belongs to the shape on the left?
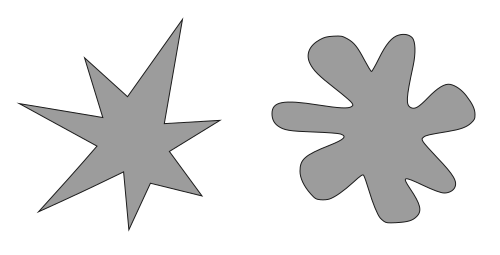
- Bouba
- Kiki
00:15
Steps of a Hypothesis Test
- Assert a model for how the data was generated (the null hypothesis)
- Select a test statistic that bears on that null hypothesis (a mean, a proportion, a difference in means, a difference in proportions, etc).
- Approximate the sampling distribution of that statistic under the null hypothesis (aka the null distribution)
- Assess the degree of consistency between that distribution and the test statistic that was actually observed (either visually or by calculating a p-value)
- Now, spend time working on the backside of your warmup sheet!
Warmup
05:00
The Null Hypothesis
- Let \(p_k\) be the probability that a person selects Kiki for the shape on the left.
- Let \(\hat{p}_k\) be the sample proportion of people that selected Kiki for the shape on the left.
Write down an equation for the null hypothesis that corresponds to the notion the link between names and shapes is arbitrary.
Select a test statistic
\[\hat{p}_k = \frac{\textrm{Number who chose "Kiki"}}{\textrm{Total number of people}}\]
Note: you could also simply \(n_k\), the number of people who chose “Kiki”.
Approximate the null distribution
Our technique: simulate data from a world in which the null is true, then calculate the test statistic on the simulated data.
Which simulation method(s) align with the null hypothesis and our data collection process of simulating from a world where the null is true?
Make a box with two cards, one that says “Kiki”, the other that says “Bouba”. Draw out n cards (the number of people who filled out the poll) with replacement, then compute \(\hat{p}_k\).
Make a box with two cards, one that says “Kiki”, the other that says “Bouba”. Draw n cards without replacement, then compute \(\hat{p}_k\).
Make a box with n cards, half of which say “Kiki”, the other half of which say “Bouba”. Draw n cards with replacement and calculate \(\hat{p}_k\).
Make a box with n cards, half of which say “Kiki”, the other half of which say “Bouba”. Draw n cards without replacement and calculate \(\hat{p}_k\).
Take a fair coin and assign Heads to “Kiki” and Tails to “Bouba”. Flip the coin n times and calculate \(\hat{p}_k\).
Approximate the null distribution
Make a box with two cards, one that says “Kiki”, the other that says “Bouba”. Draw out n cards (the number of people who filled out the poll) with replacement, then compute \(\hat{p}_k\).
Make a box with two cards, one that says “Kiki”, the other that says “Bouba”. Draw n cards without replacement, then compute \(\hat{p}_k\).
Make a box with n cards, half of which say “Kiki”, the other half of which say “Bouba”. Draw n cards with replacement and calculate \(\hat{p}_k\).
Make a box with n cards, half of which say “Kiki”, the other half of which say “Bouba”. Draw n cards without replacement and calculate \(\hat{p}_k\).
Take a fair coin and assign Heads to “Kiki” and Tails to “Bouba”. Flip the coin n times and calculate \(\hat{p}_k\).
- The first, third, and fifth answer choices are valid options. Each of these options make sure that, for each of the n times we simulate a person’s decision, the probability of their decision being that the left shape is “Kiki” is 50 percent.
3. Approximate the null distribution
Let’s now use infer to do the simulation!
4. Assess the consistency of the data and the null
What is the proper interpretation of the p-value?
The Bouba / Kiki Effect
Break
05:00
Worksheet
30:00