Bootstrapping
Which of the bar charts below represents a valid bootstrap sample drawn from the original sample?
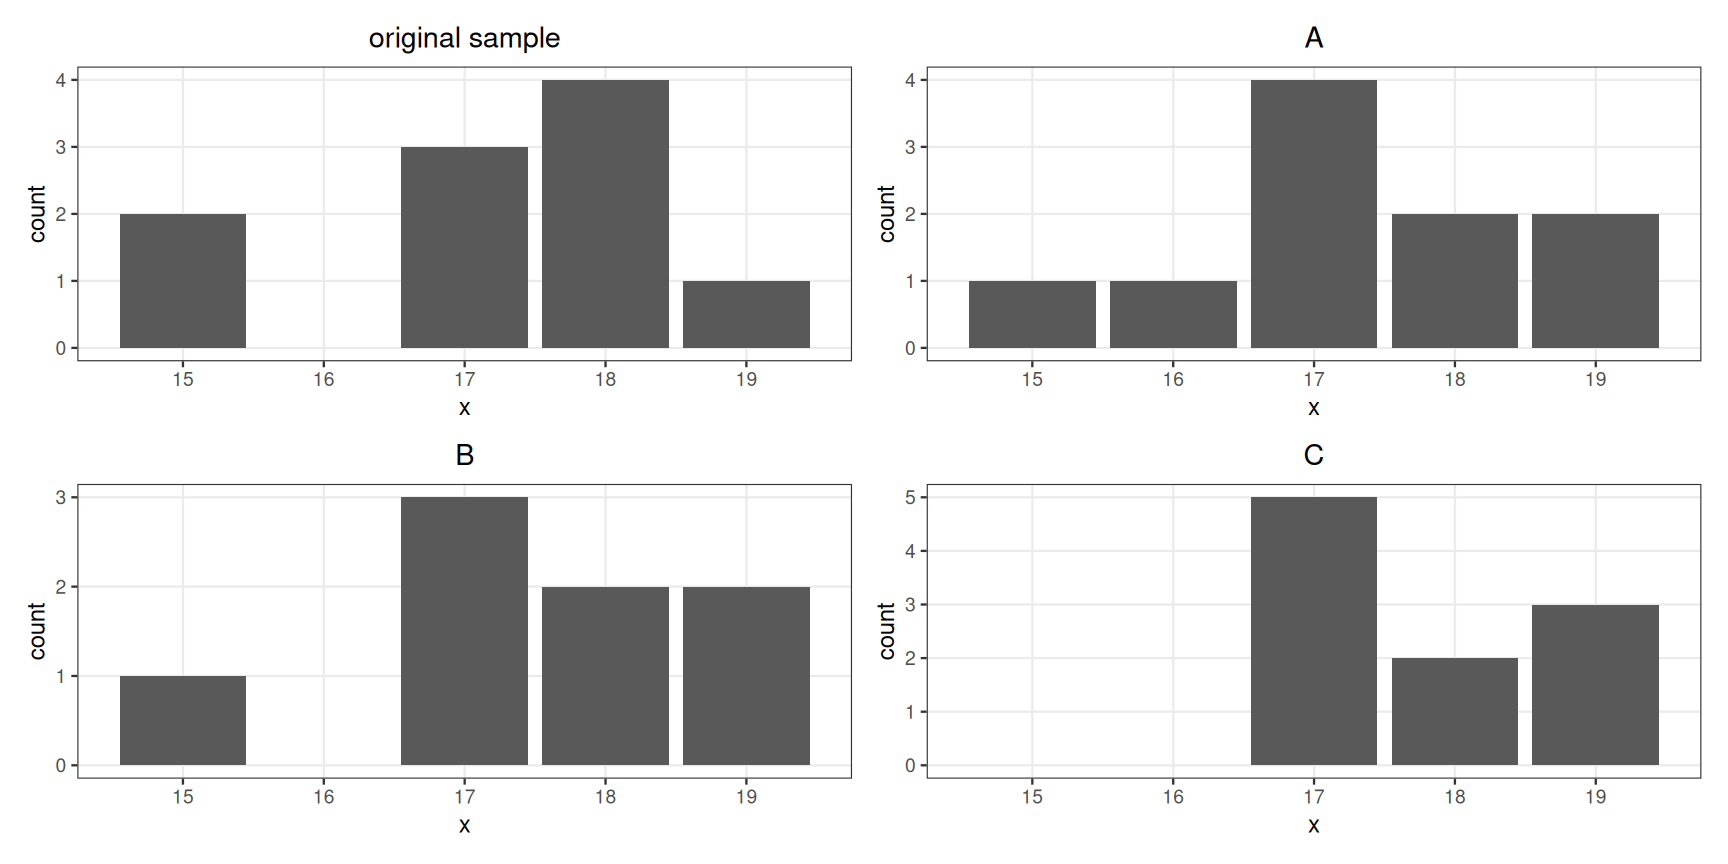
Plot C is the option with a correct bootstrap sample.
Plot A introduces a value of 16, which did not exist in the original sample.
Plot B has a sample size that is too small. The sample must be of size 10.
Plot C is of the correct size and contains onlu values which appear in the original sample.