set.seed(12345)

coin <- c("Heads", "Tails")
tosses <- sample(coin, 10, replace = TRUE)
data.frame(tosses) |>
  group_by(tosses) |>
  summarise(n = n())
# A tibble: 2 × 2
tosses n
<chr> <int>
1 Heads 3
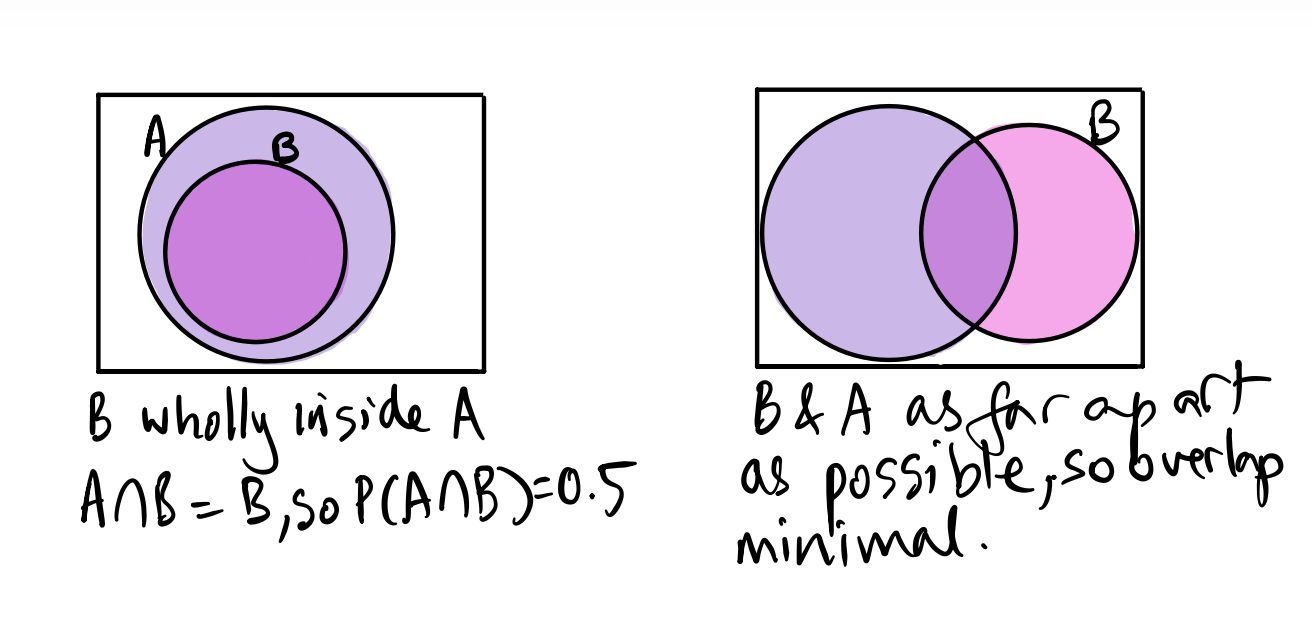
2 Tails 7We have two events \(A\) and \(B\) in an outcome space \(\Omega\). If \(P(A) = 0.7\) and \(P(B) = 0.5\), can \(A\) and \(B\) be mutually exclusive? Draw a Venn diagram and use it to say what is the largest that the intersection of \(A\) and \(B\) could possibly be. Also, what is the smallest this value can be. That is, find upper and lower bounds on the value of \(P(A \cap B)\).
00:30
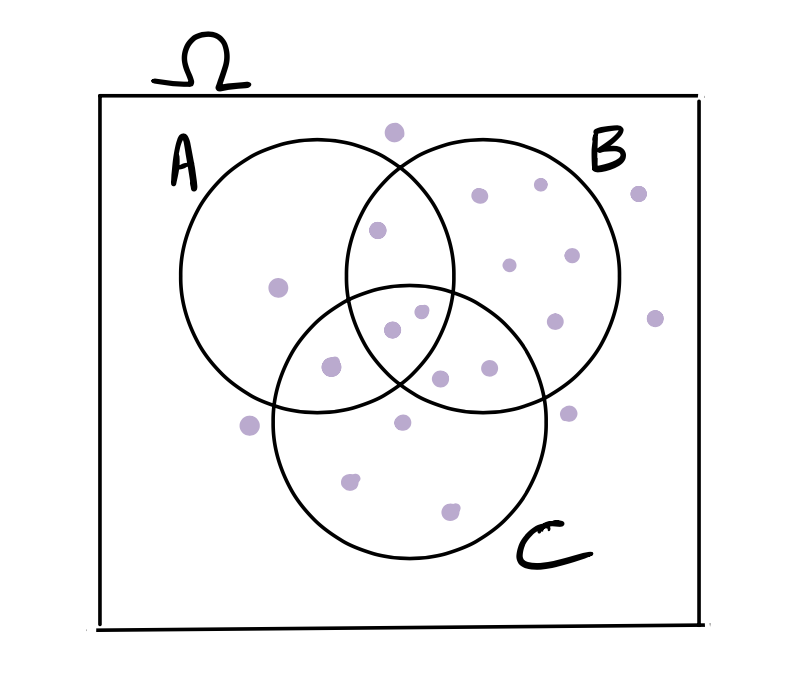
Consider the Venn diagram below, which has 20 possible outcomes in \(\Omega\), depicted by the purple dots. Suppose the dots represent equally likely outcomes. What is the probability of \(A\) or \(B\) or \(C\)? That is, what is \(P(A \cup B \cup C)\)?
Using the complement rule, \(P(A\cup B \cup C) = 1-\dfrac{5}{20} = \dfrac{15}{20}\)
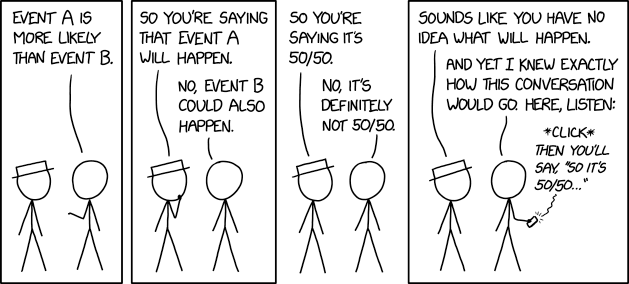
xkcd comic showing two people discussing what it means to have a 50-50 chance
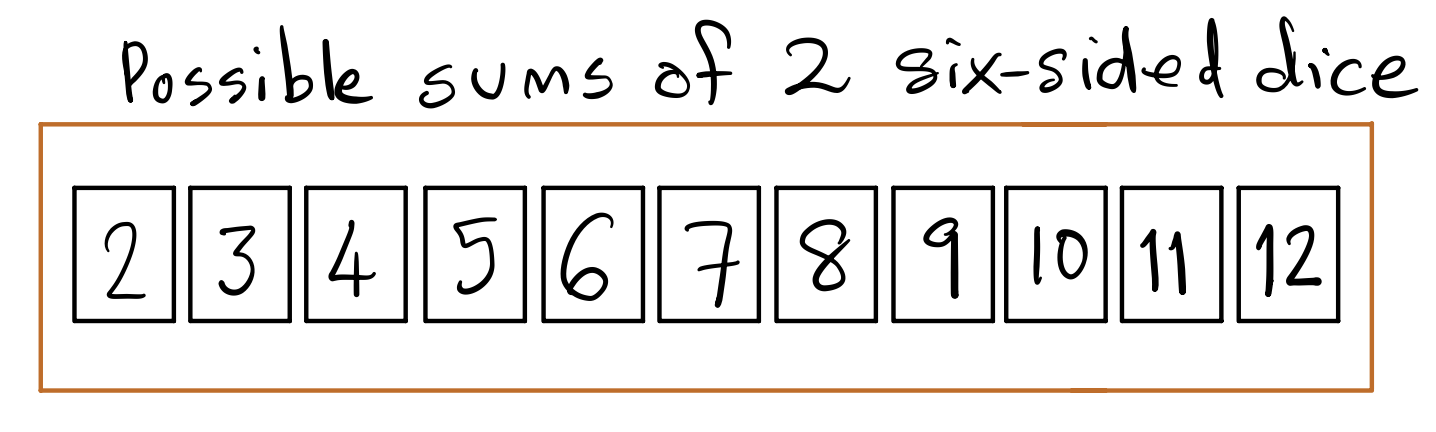
Suppose we toss a pair of fair six-sided dice, and sum the spots (such as when we play Monopoly). We want to model this using a box of tickets. Will the box shown here work? If so, how many times should we draw, and if not, why not?
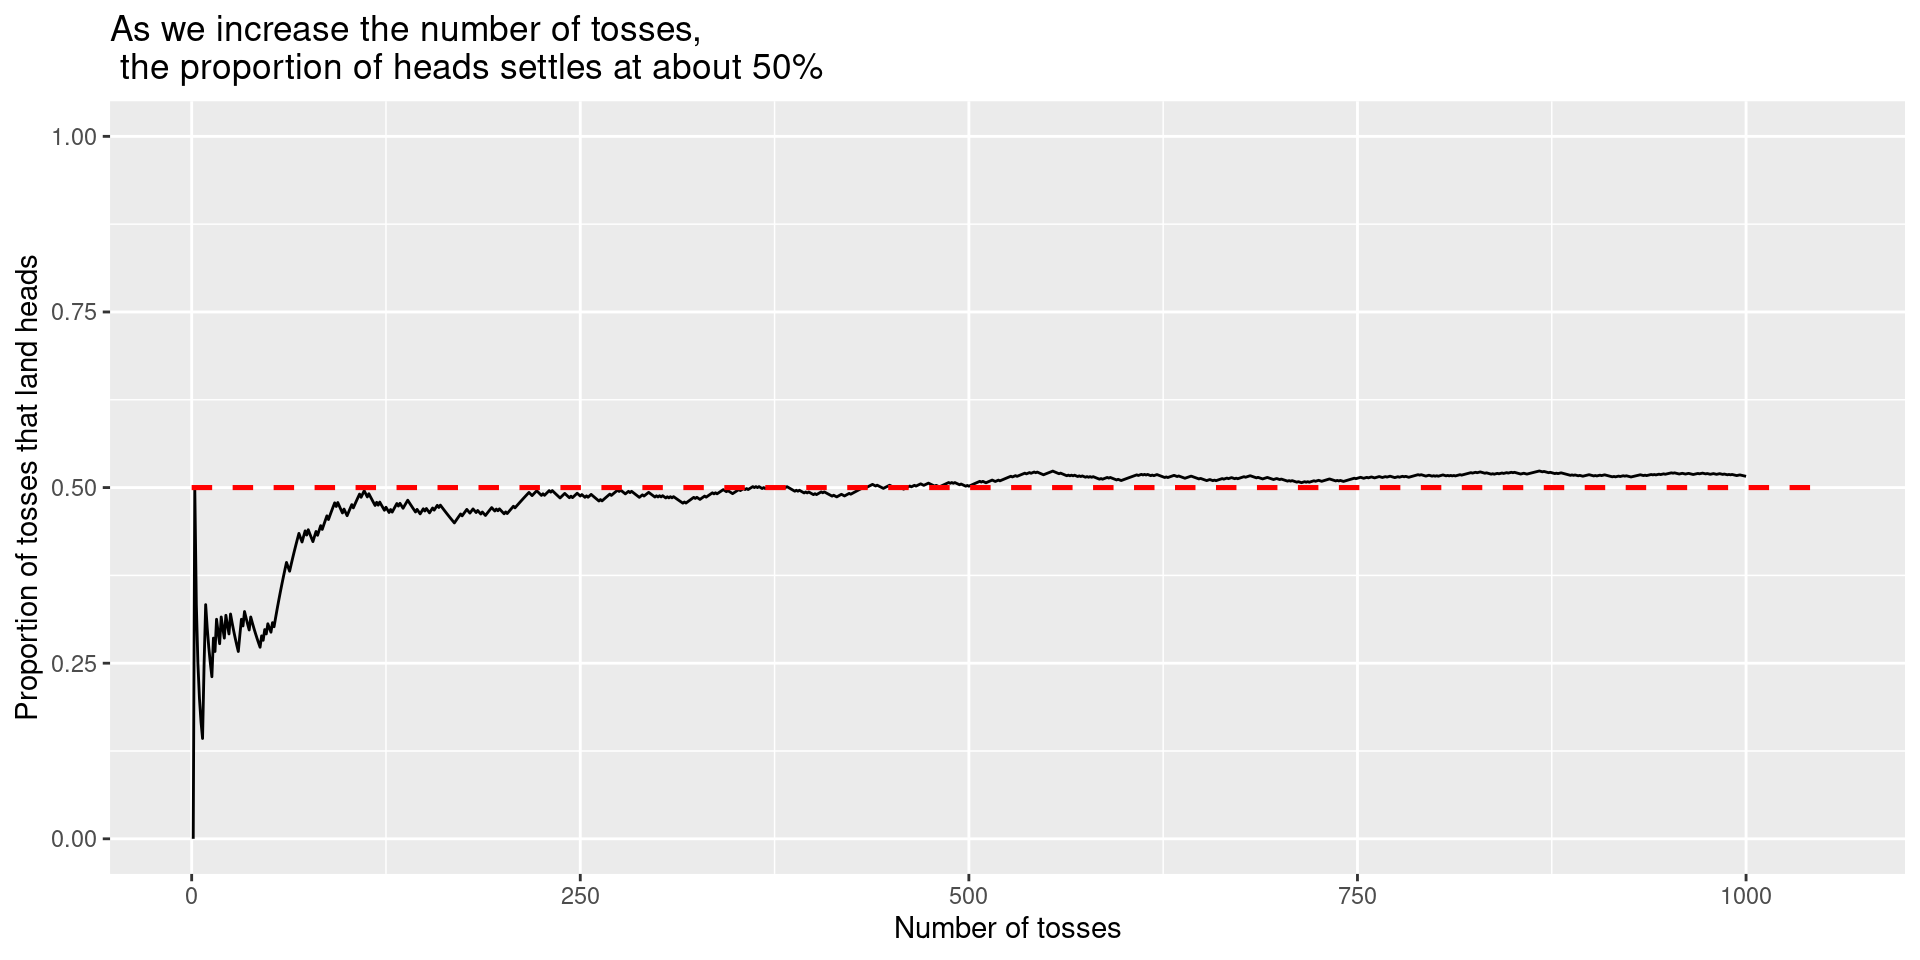
Here is a plot of the proportion of tosses that land heads when we toss a coin \(n\) times, where \(n\) varies from \(1\) to \(1000\).