Taxonomy of Data
Concept Questions
A note on variables
There are three things that “variable” could be referring to:
- a phenomenon
- how the phenomenon is being recorded or measured into data
- what values can it take? (this is often an intent- or value-laden exercise!)
- for numerical units, what unit should we express it in?
- How the recorded data is being analyzed
- might you bin/discretizing income data? what are the consequences of this?
- For the following question, you may work under the second definition.
What type of variable is age?
Match each of the scenarios where age could be a variable, on the next three slides, to the most appropriate taxonomy according to the Taxonomy of Data.
What type of variable is age? (Part 1)
- Age ranges of television audiences/demographics
Answer at pollev.com.
00:30
What type of variable is age? (Part 2)
- Ages of UC Berkeley students
Answer at pollev.com.
00:30
What type of variable is age? (Part 3)
- The age of a lightbulb (time until it stops working)
Answer at pollev.com.
00:30
Educated Guesses
- In the following few concept questions, you’ll see a line of R code and have to think about what will happen when it runs!
Educated Guess 1
What will happen here?
Answer at pollev.com/<name>
01:00
Educated Guess 2
What will happen here?
Answer at pollev.com/<name>
01:00
Educated Guess 3
What will happen here?
Answer at pollev.com/<name>
01:00
Educated Guess 4
What will happen here?
Answer at pollev.com/<name>
01:00
Images as data
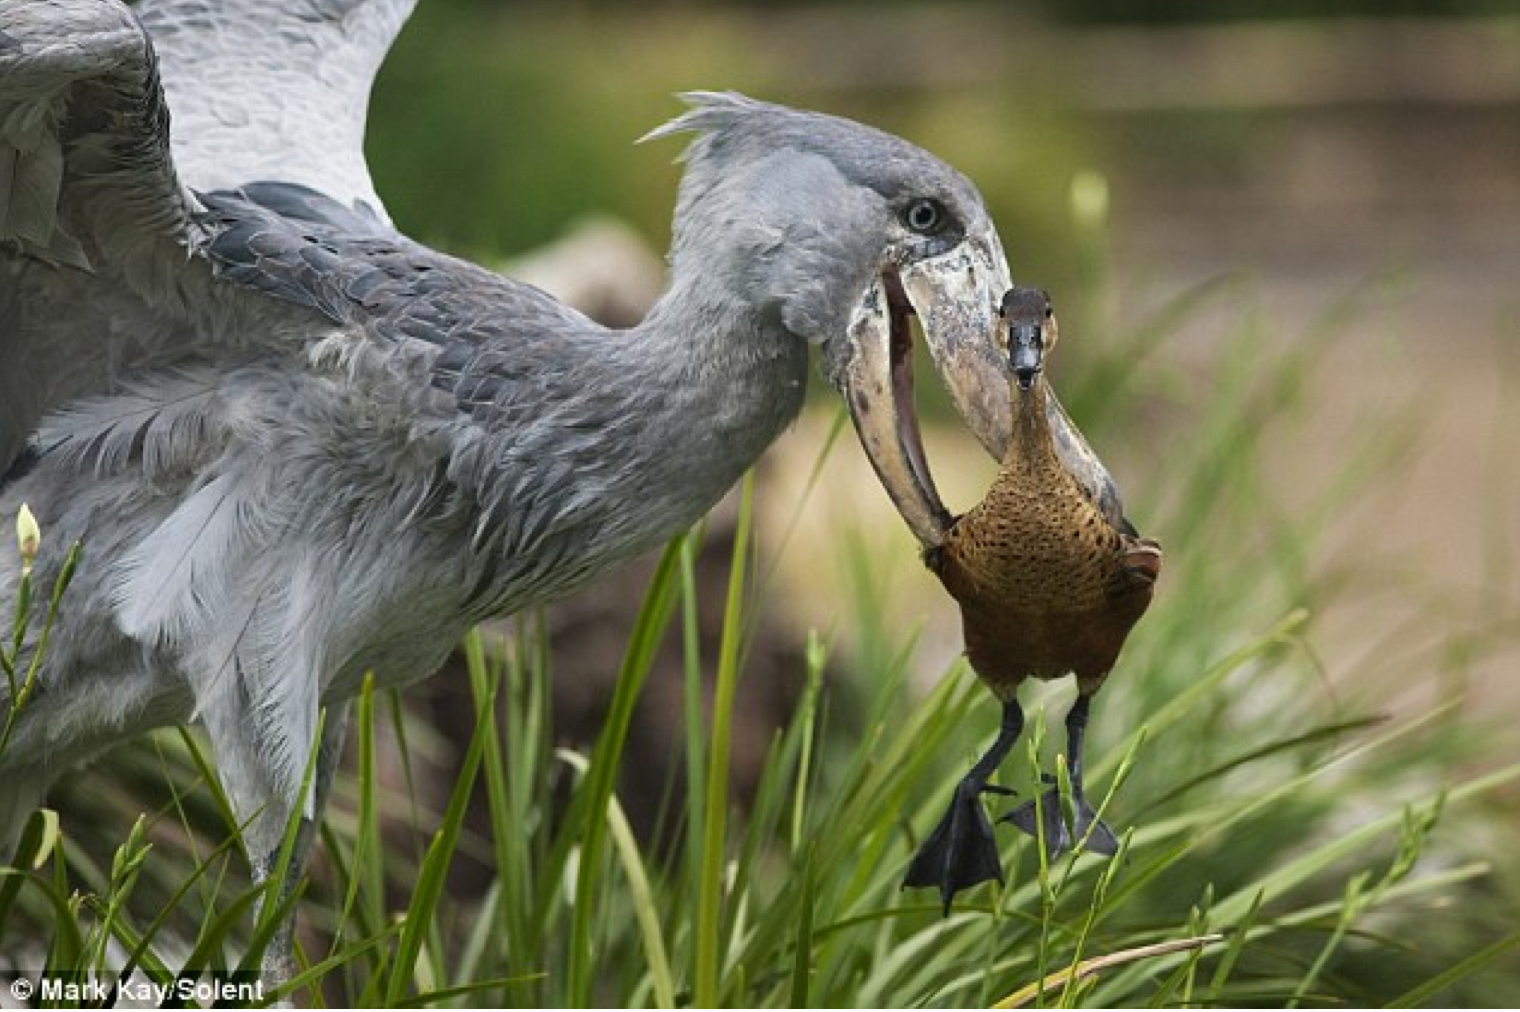
Images are composed of pixels (this image is 1520 by 1012)
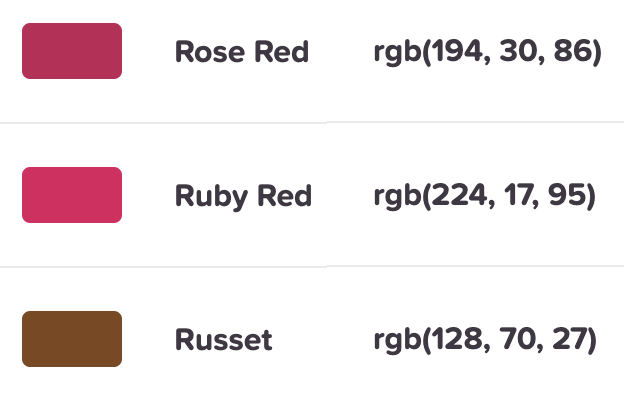
The color in each pixel is in RGB
![]()
Each band takes a value from 0-255
This image is data with 1520 x 1012 x 3 values.
Grayscale
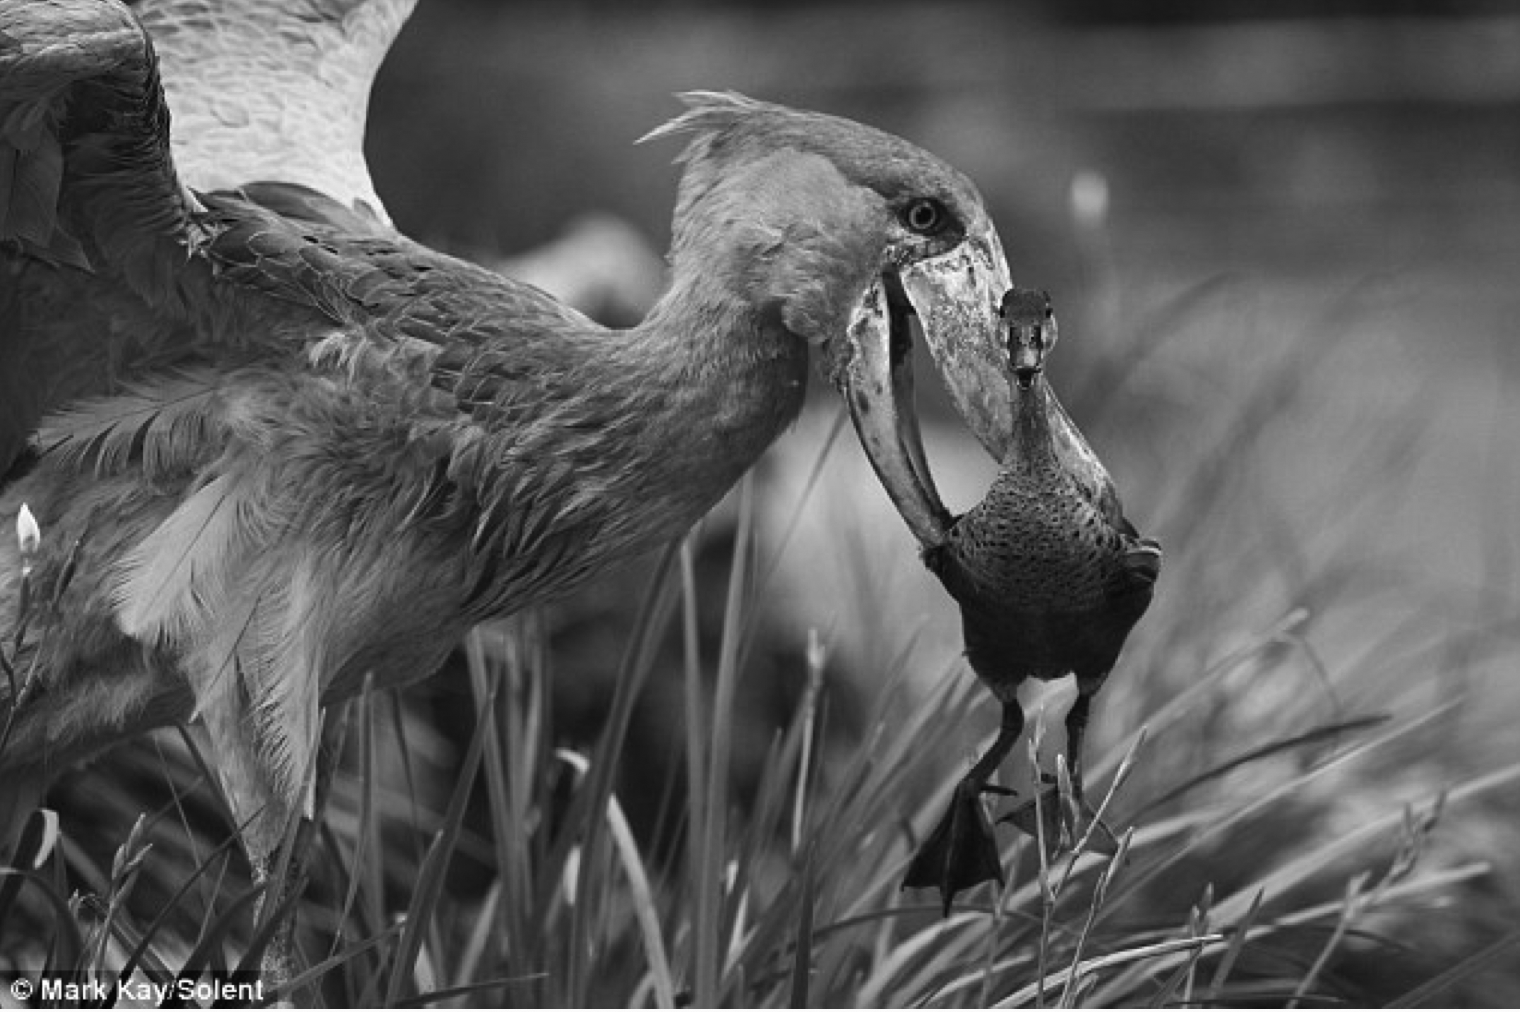
- Grayscale images have only one band
- 0 is black, 255 is white
- This image is data with 1520 x 1012 x 1 values.
Grayscale
- To simplify, assume our photos are 8 x 8 grayscale images.

Images in a Data Frame
Consider the following images which are our data:

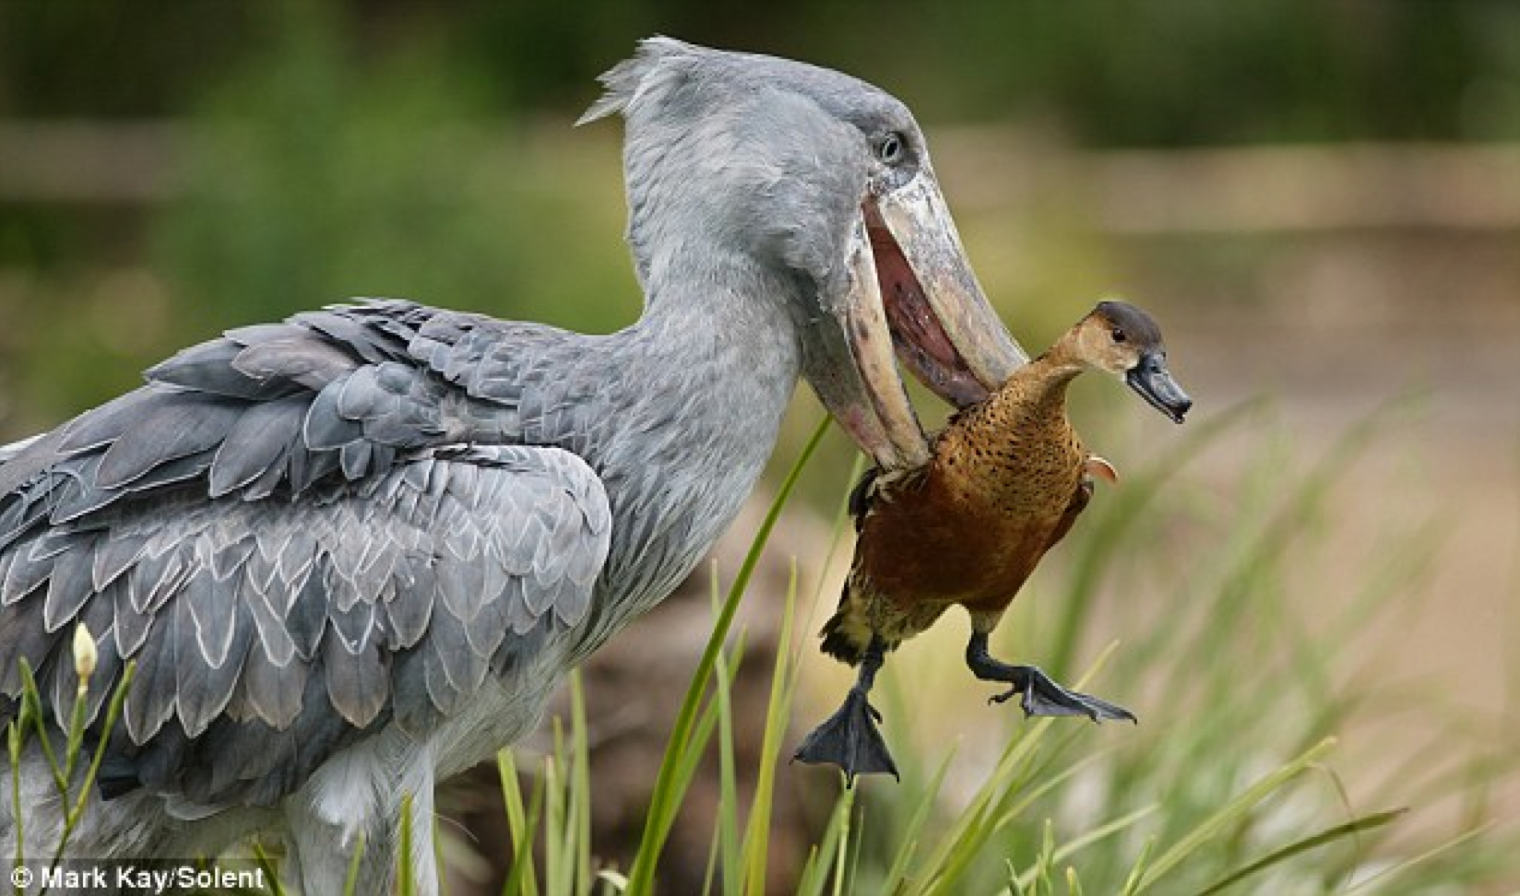
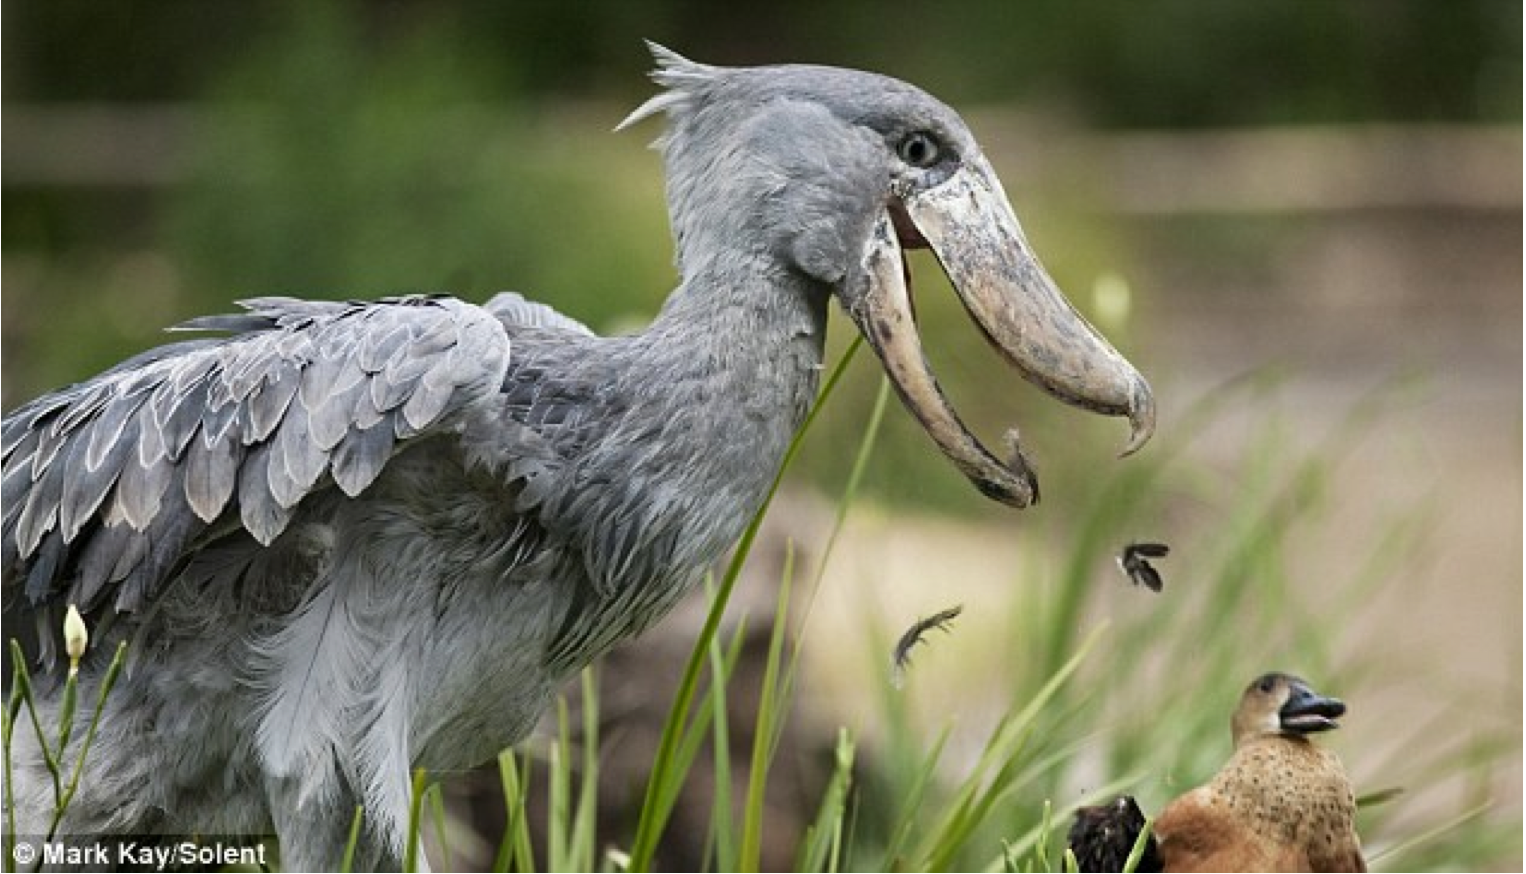
- Let’s simplify them to 8 x 8 grayscale images
Images in a Data Frame


If you were to put the data from these (8 x 8 grayscale) images into a data frame, what would the dimensions of that data frame be in rows x columns? Answer at pollev.com.
01:00
Break
05:00
Problem Set: Taxonomy of Data
20:00
